
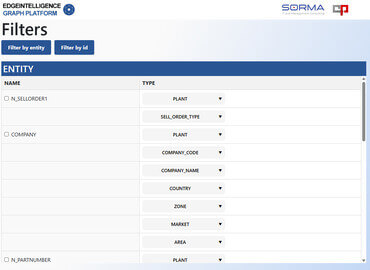
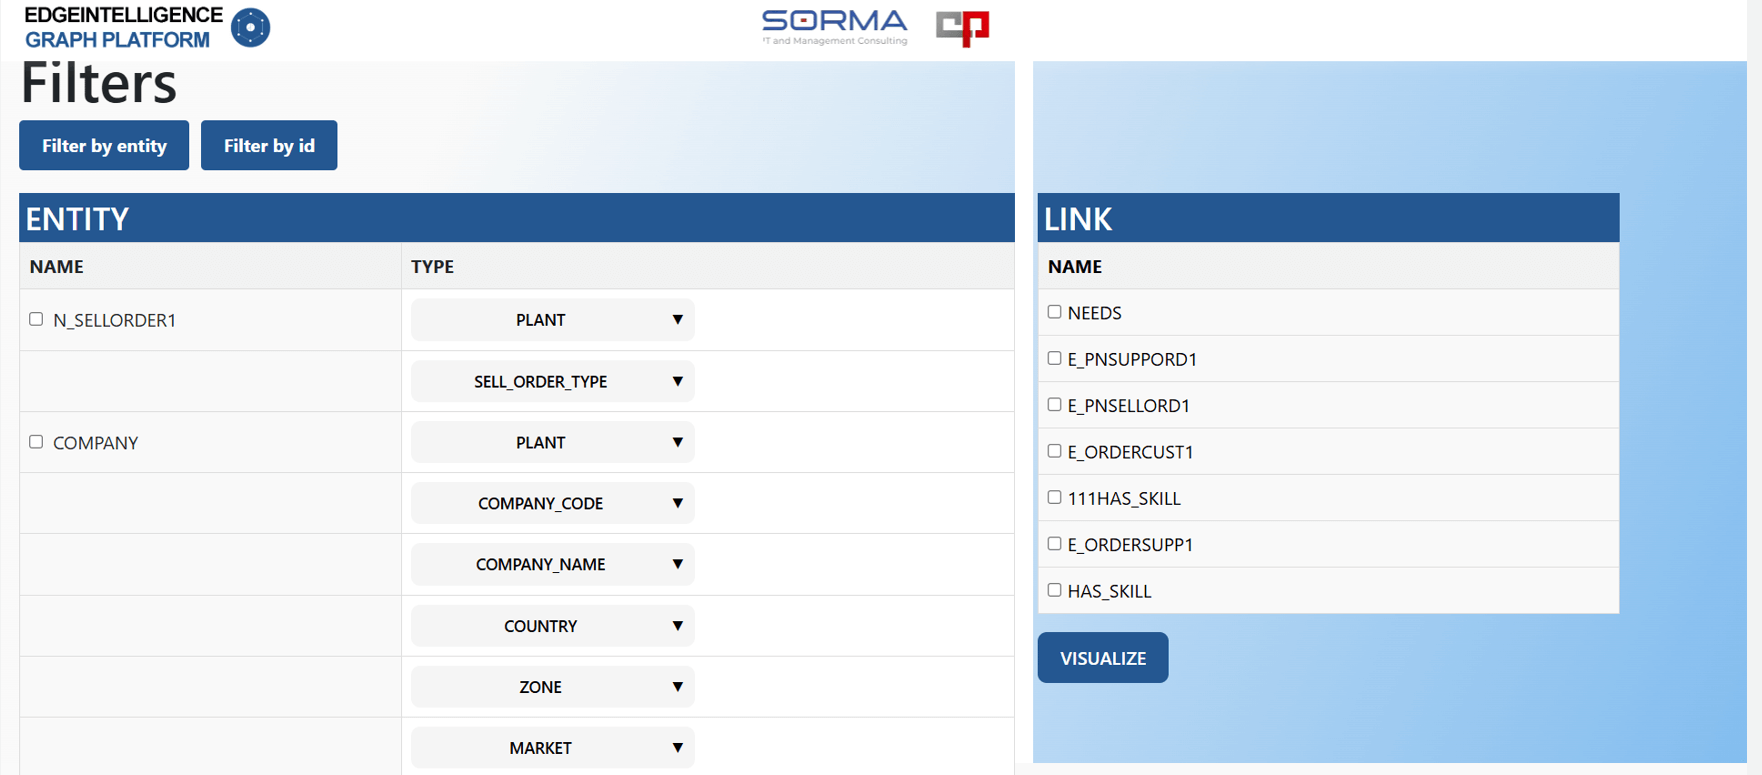
Edge Intelligence Data Visualization Platform
The project hosted at Edge Intelligence is a cutting-edge data visualization platform designed to deliver interactive, real-time insights through rich graphical representations. Built using React.js, the platform ensures a highly responsive and modular user interface. Advanced visualizations are achieved with D3.js for dynamic charts and Three.js for immersive 3D graphics.
Visit the live project to explore more: https://213.21.189.116/EDGE_INTELLIGENCE/admin/visualize
The backend is powered by Python, handling data processing and logic efficiently to support complex visual interactions. One of the key components enhancing this system is Sposgras, which contributes to the structured handling and analysis of spatial or graphical data (depending on implementation specifics).
Together, these technologies form a robust ecosystem that empowers users to explore, interpret, and interact with complex datasets in intuitive ways. The platform is ideal for users in technical and analytical fields who need a visually rich environment to make data-driven decisions.
Project Info
- Category: Data Visualization / React JS
- Technologies: React.js,Three.js,D3.js
- Backend Technologies: Python, Sposgras
- Client: Sorna Group
- Location: Cesena, Itlay